5. Winer denoise audio filter
[1]:
import matplotlib.pyplot as plt
import torch

from cutcutcodec.core.generation.audio.equation import GeneratorAudioEquation
from cutcutcodec.core.generation.audio.noise import GeneratorAudioNoise
5.1. Create a syntetic noise
In a winer filter, the noise has to be ergodic.
[2]:
# simulate a wite noise plus a 50Hz sector electrical noise
noise = GeneratorAudioNoise().apply_audio_equation(
    "0.3*fl_0 + 0.2*sin(2*pi*100*t) + 0.1*sin(2*pi*200*t) + 0.1*sin(2*pi*400*t) + 0.05*sin(2*pi*800*t)",
    "0.3*fr_0 + 0.2*cos(2*pi*100*t) + 0.1*cos(2*pi*200*t) + 0.1*cos(2*pi*400*t) + 0.05*cos(2*pi*800*t)",
)
5.2. Create a syntetic perfect signal
[3]:
# make a stereo musical note A
perfect = GeneratorAudioEquation(
    "0.6*sin(2*pi*440*t) + 0.2*sin(2*pi*880*t)",
    "0.6*cos(2*pi*440*t) + 0.2*cos(2*pi*880*t)",
)
# add 10 seconds of silence at the beginning
perfect = (GeneratorAudioEquation("0", "0").apply_audio_subclip(0, 10) | perfect).apply_audio_cat()
5.3. Add the two signals to make realisic noisy signal
[4]:
noisy = (perfect | noise).apply_audio_add()
5.4. Use Winer filter to denoised the signal
[5]:
noise_sample = noisy.apply_audio_subclip(0, 5)  # select 5 second of noise
denoised = (noise_sample | noisy).apply_audio_wiener(level=1.0)
[6]:
rate = 8000
noise_frame = noise.out_streams[0].snapshot(0, rate, 20*rate)
perfect_frame = perfect.out_streams[0].snapshot(0, rate, 20*rate)
noisy_frame = noisy.out_streams[0].snapshot(0, rate, 20*rate)
denoised_frame = denoised.out_streams[0].snapshot(0, rate, 20*rate)
5.5. Visualise the signal
[7]:
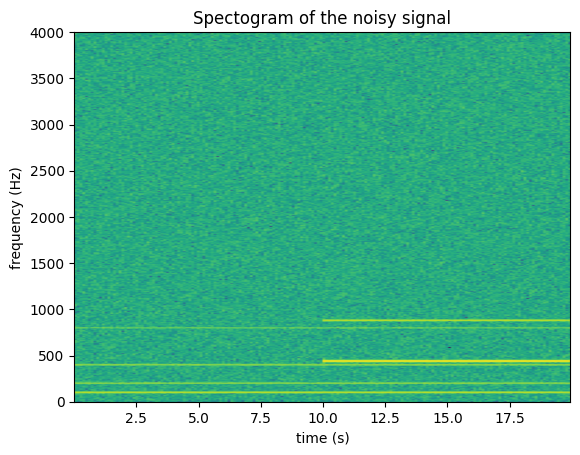
# display noisy frame
plt.title("Spectogram of the noisy signal")
plt.xlabel("time (s)")
plt.ylabel("frequency (Hz)")
plt.specgram(noisy_frame[0], Fs=noisy_frame.rate, NFFT=1024)
plt.show()
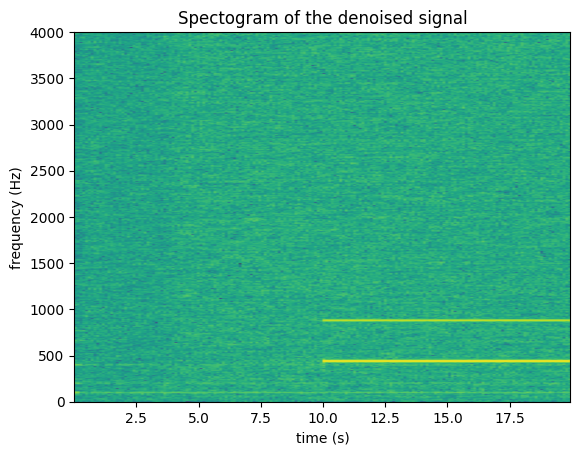
# display denoised frame
plt.title("Spectogram of the denoised signal")
plt.xlabel("time (s)")
plt.ylabel("frequency (Hz)")
plt.specgram(denoised_frame[0], Fs=denoised_frame.rate, NFFT=1024)
plt.show()
[8]:
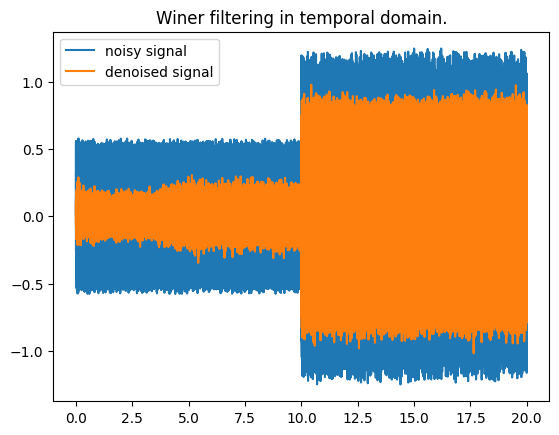
# signal in temporal domains
plt.title("Winer filtering in temporal domain.")
plt.plot(torch.arange(noisy_frame.shape[1]) / noisy_frame.rate, noisy_frame[0], label="noisy signal")
plt.plot(torch.arange(denoised_frame.shape[1]) / denoised_frame.rate, denoised_frame[0], label="denoised signal")
plt.legend()
plt.show()