1. Read an audio and video file
[1]:
import matplotlib.pyplot as plt

import cutcutcodec
[2]:
from cutcutcodec.utils import get_project_root
file = get_project_root().parent / "media" / "video" / "intro.webm"  # your media path
container = cutcutcodec.read(file)  # open the file
stream_a = container.out_select("audio")[0]  # first audio stream
stream_v = container.out_select("video")[0]  # first video stream
[3]:
# general properties
print(f"container of the file {file}")
print(f"{stream_a.layout.name} audio of {float(stream_a.duration):.1f} s at {stream_a.rate} Hz")
height, width = cutcutcodec.core.analysis.stream.optimal_shape_video(stream_v)
fps = cutcutcodec.core.analysis.stream.optimal_rate_video(stream_v)
print(f"{width}x{height} video of {float(stream_v.duration):.1f} s at {fps} fps")
container of the file /home/robin/documents/programation/python/en_cours/cutcutcodec_git/media/video/intro.webm
stereo audio of 9.9 s at 22050 Hz
1280x720 video of 9.8 s at 30000/1001 fps
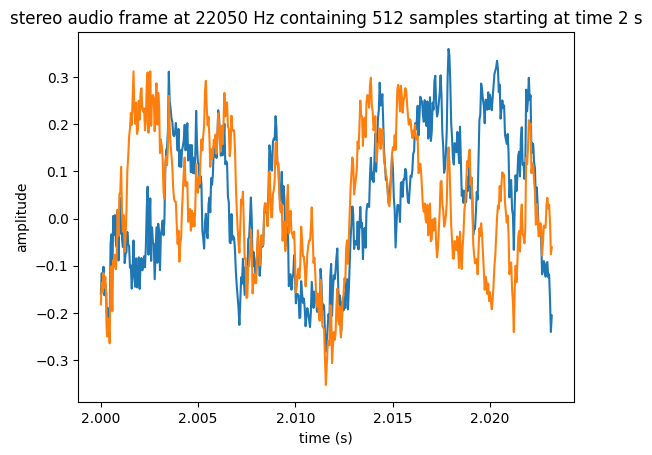
1.1. Read Audio
[4]:
frame_a = stream_a.snapshot(2.0, stream_a.rate, 512) # time, sample rate, nbr samples
WARNING:root:audio frame overlap of 0.003000 seconds detected
[5]:
plt.plot(frame_a.timestamps, frame_a.T)
plt.xlabel("time (s)")
plt.ylabel("amplitude")
plt.title(
    f"{frame_a.layout.name} audio frame at {frame_a.rate} Hz "
    f"containing {frame_a.samples} samples starting at time {frame_a.time} s"
)
plt.show()
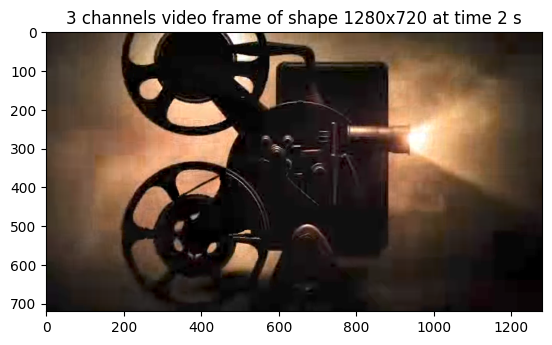
1.2. Read Video
[6]:
stream_v_srgb = stream_v.apply_video_colorspace(cutcutcodec.Colorspace.from_default_target_rgb())
frame_v = stream_v_srgb.snapshot(2.0, (height, width))
[7]:
plt.imshow(frame_v)
plt.title(f"{frame_v.channels} channels video frame of shape {frame_v.width}x{frame_v.height} at time {frame_v.time} s")
plt.show()
WARNING:matplotlib.image:Clipping input data to the valid range for imshow with RGB data ([0..1] for floats or [0..255] for integers). Got range [-0.69949996..1.1666989].