5. Wiener denoise audio filter
Let try the online demo app!
[1]:
import matplotlib.pyplot as plt
import torch

import cutcutcodec
5.1. Read, Denoise and Write
In a Wiener filter, the noise profile has to be ergodic.
There is two important arguments:
level: The denoising ratio in \([0, 1]\). 0 doese nothing while 1 is the maximum denoising level.
band: The spectral band width in Hz, bigger it is, less it is noisy but less it is accurate.
[2]:
FILE = cutcutcodec.utils.get_project_root() / "media" / "audio" / "wiener.wav"
RATE = 44100

# read the signal
with cutcutcodec.read(FILE) as noisy_container:

    # extract the noise
    start = 22.0  # start time
    noise_container = noisy_container.apply_audio_subclip(start, torch.inf).apply_audio_delay(-start)

    # denoised with wiener (band=20 is nice for white noise, band=1.0 for cloc)
    denoised_container = (noise_container | noisy_container).apply_audio_wiener(level=0.98, band=20.0)

    # plot signals
    noisy_stream = noisy_container.out_streams[0]
    denoised_stream = denoised_container.out_streams[0]
    noisy_signal = noisy_stream.snapshot(0, RATE, int(RATE*noisy_stream.duration))
    denoised_signal = denoised_stream.snapshot(0, RATE, int(RATE*denoised_stream.duration))

    # save signal
    output = (noisy_stream | denoised_stream).apply_audio_cat()
    cutcutcodec.write(output.out_streams, "/tmp/denoised_wiener.flac", streams_settings=[{"encodec": "flac", "rate": RATE}])
Encoding denoised_wiener.flac: 100%|███████████████████████████████████████████████████| 102.31s/102.31s [00:01<00:00]
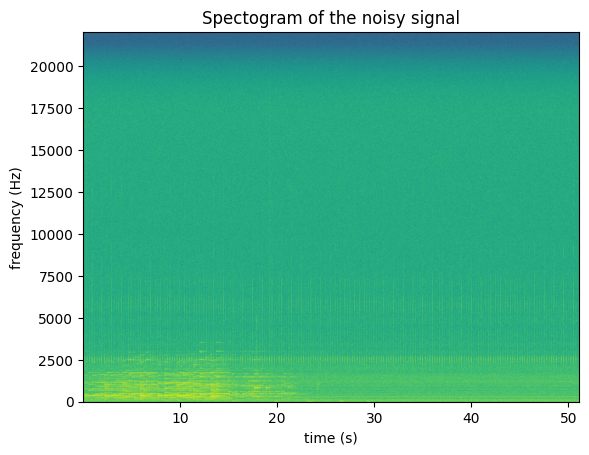
5.2. Plot spectrograms
[3]:
# display noisy frame
plt.title("Spectogram of the noisy signal")
plt.xlabel("time (s)")
plt.ylabel("frequency (Hz)")
plt.specgram(noisy_signal[0], Fs=RATE, NFFT=2048)
plt.show()
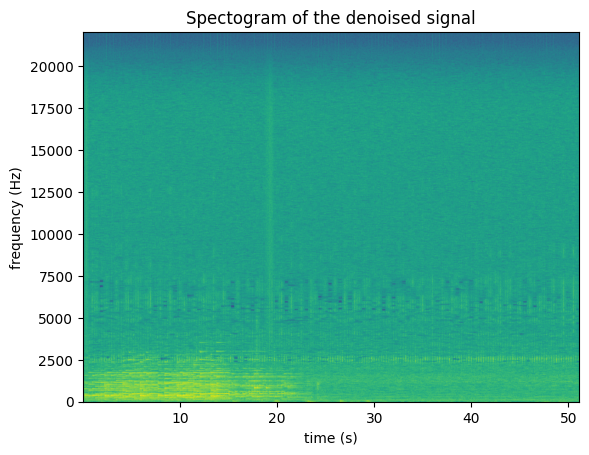
# display denoised frame
plt.title("Spectogram of the denoised signal")
plt.xlabel("time (s)")
plt.ylabel("frequency (Hz)")
plt.specgram(denoised_signal[0], Fs=RATE, NFFT=2048)
plt.show()
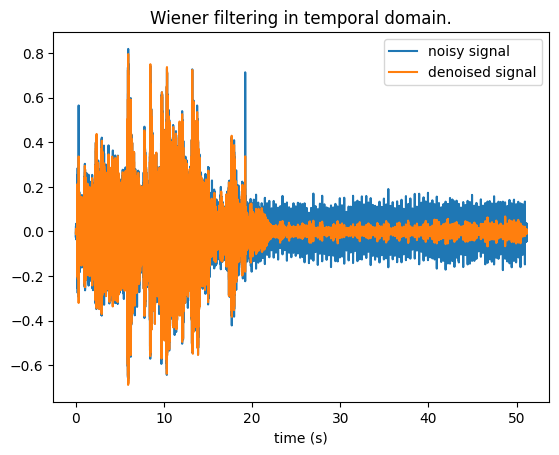
5.3. Plot temporal signals
[4]:
# signal in temporal domains
plt.title("Wiener filtering in temporal domain.")
plt.plot(torch.arange(noisy_signal.shape[1]) / RATE, noisy_signal[0], label="noisy signal")
plt.plot(torch.arange(denoised_signal.shape[1]) / RATE, denoised_signal[0], label="denoised signal")
plt.xlabel("time (s)")
plt.legend()
plt.show()